
Release on: 16-11-2026
- New Features
- →New: Drain % for Drain Sense
- How is it calculated?
- →New: More languages
- →New: Camera points in alerts
- →New: More statistics in the Microscope
- Small Updates
- Bug Fixes
We have released a new update to the Sigrow web app. Here is what changed and what was added.
New Features
→New: Drain % for Drain Sense
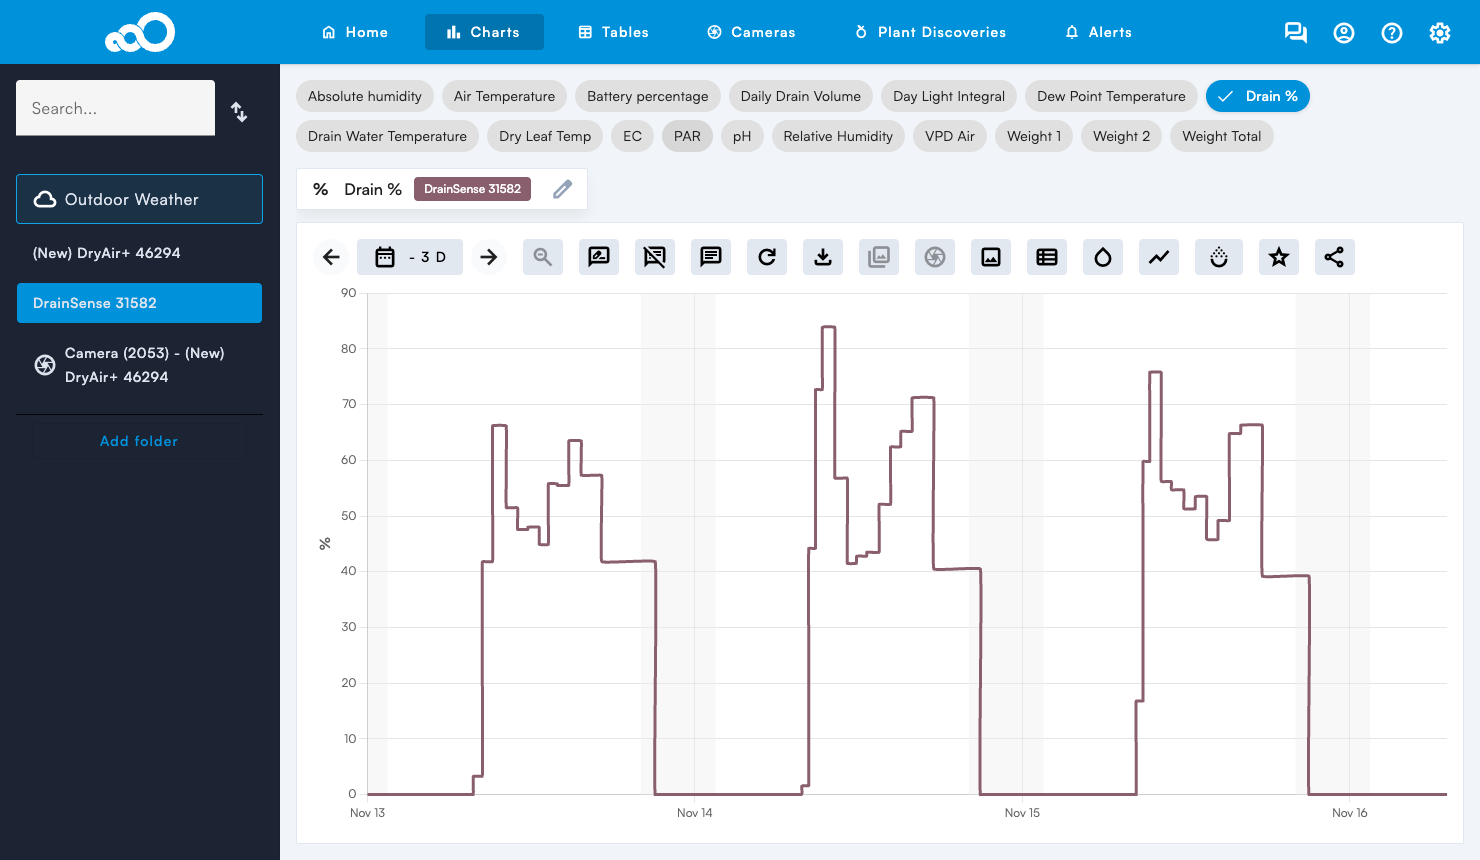
A new variable, Drain %, shows how much of each irrigation shot ran out as drain. You can plot it on the Charts page like any other variable of your Drain Sense.
How is it calculated?
- A shot starts when the weight plus the drain rises by 100 ml or more within 5 minutes.
- Water in = the weight rise plus the drain that ran out during that rise.
- Drain = the drain from that shot until the next shot starts. For the last shot of the day, until midnight.
- Drain % = drain ÷ water in.
Note - Drain % is drawn as a stepped line: the value stays the same until the next shot. To have Drain % added to your location, contact support@sigrow.com.
→New: More languages
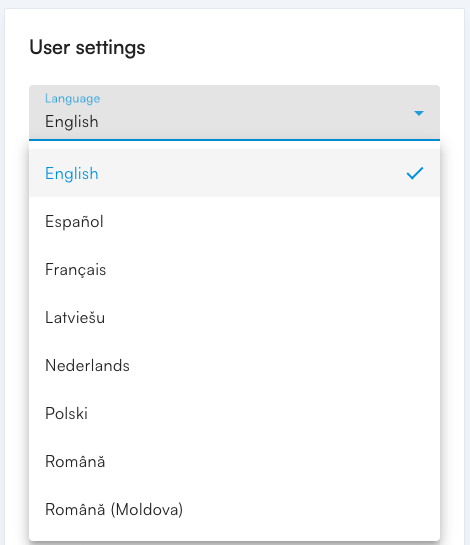
The app is now also available in French, Polish, Latvian and Romanian (also as Romanian for Moldova), next to English, Dutch and Spanish.
Choose your language on the Configuration page (gear icon at the top right), under User settings.
Note - the names of ready-made widget templates and the answers of the widget AI assistant are still in English.
→New: Camera points in alerts
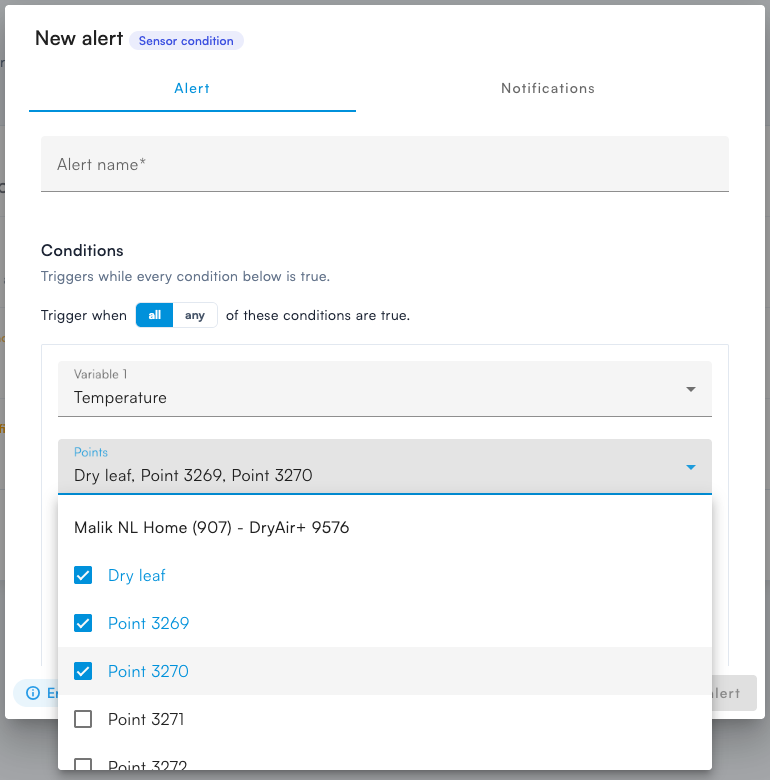
You can now use the points of your Stomata Camera in a Sensor condition alert. In the variable list, choose Temperature or VPD under Camera points, then tick the points.
One alert can watch several points of the same camera. You get the alert as soon as any of these points crosses your limit, and the email names the points that crossed. For example: select all points of a camera and compare them with the dew point temperature to be warned about condensation.
→New: More statistics in the Microscope
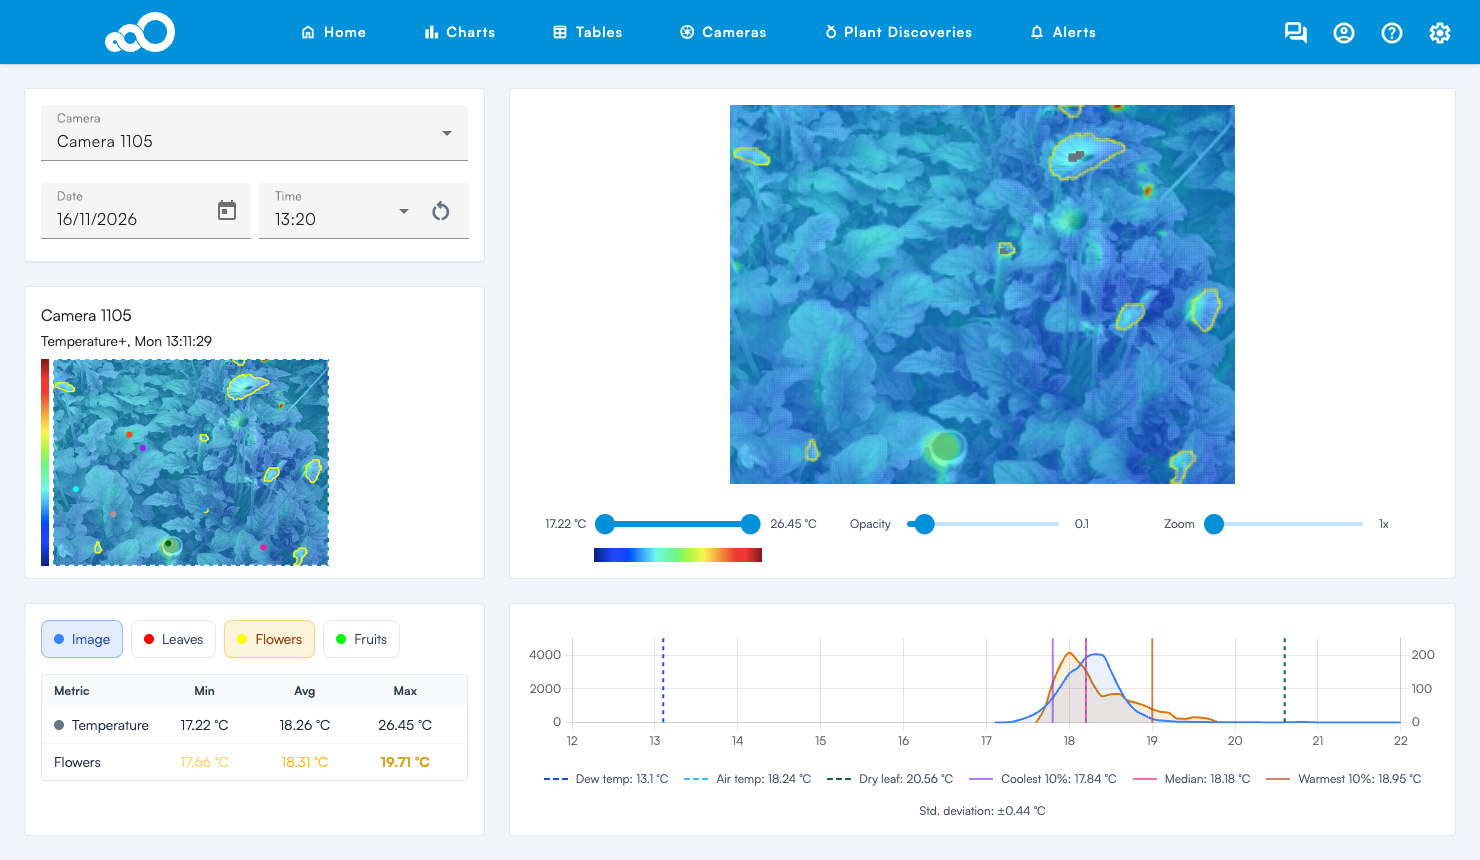
On the Microscope page (under Cameras), the temperature distribution chart now shows three extra lines, Coolest 10%, Median and Warmest 10%, plus the Std. deviation. They appear when you select one type (leaves, flowers or fruits).
They show how evenly the temperature is spread over the selected area. For example, the Warmest 10% line shows how warm the warmest part of the fruit surface is, where ripening goes fastest.
Small Updates
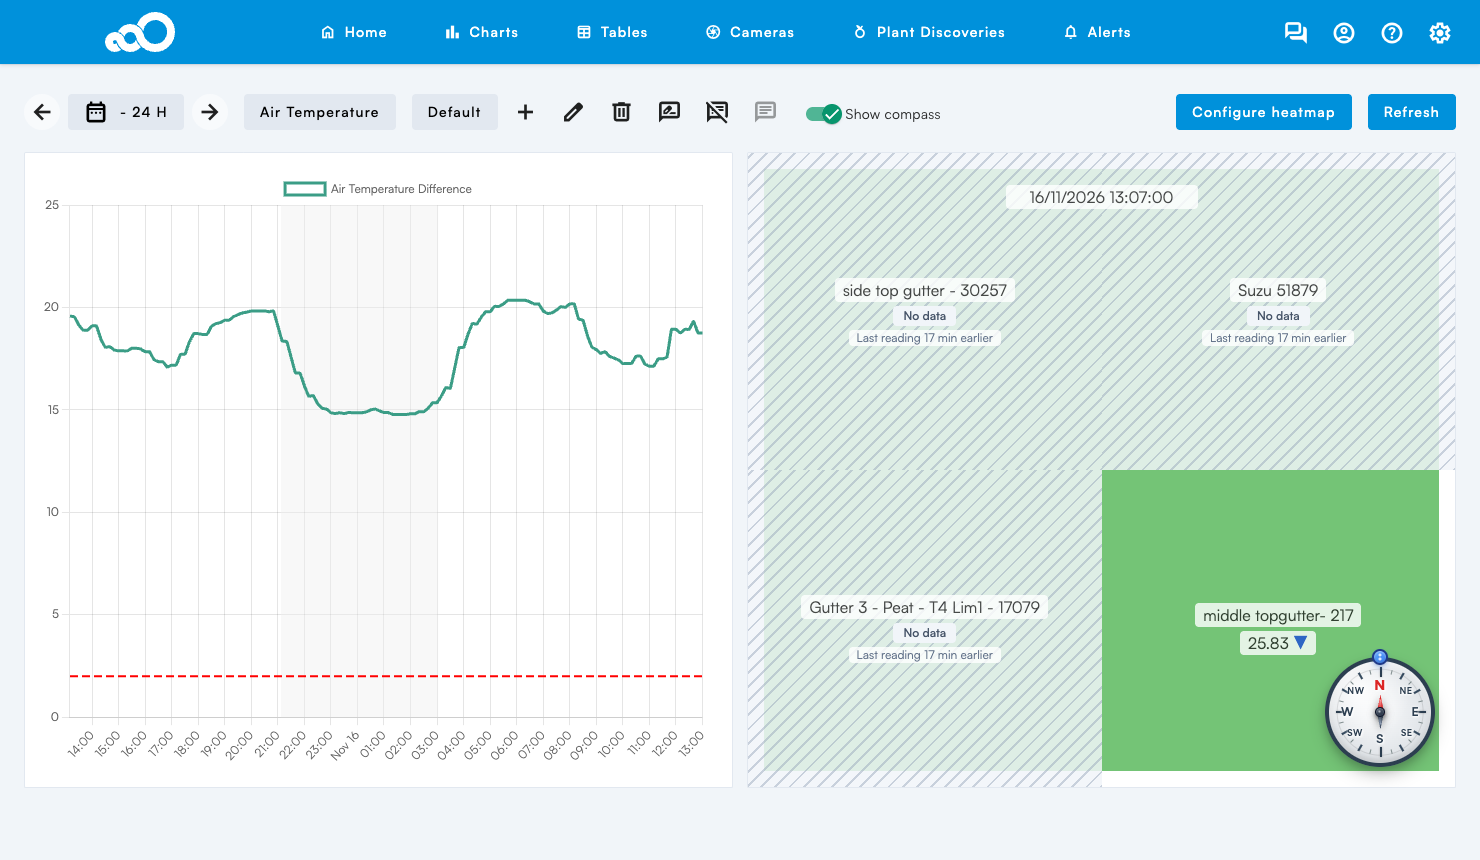
- Update - Heatmap marks sensors without recent data
When a sensor has not sent data for more than 15 minutes, the Heatmap no longer shows its old value as if it were live. The sensor is drawn hatched, with how long ago it last reported, and it is left out of the minimum, maximum and difference.
- Update - Alert emails in Dutch
If your app language is Dutch, your alert emails are now in Dutch too.
- Update - Variables on the Charts page in alphabetical order
The variable buttons on the Charts page are now sorted alphabetically, in your own language.

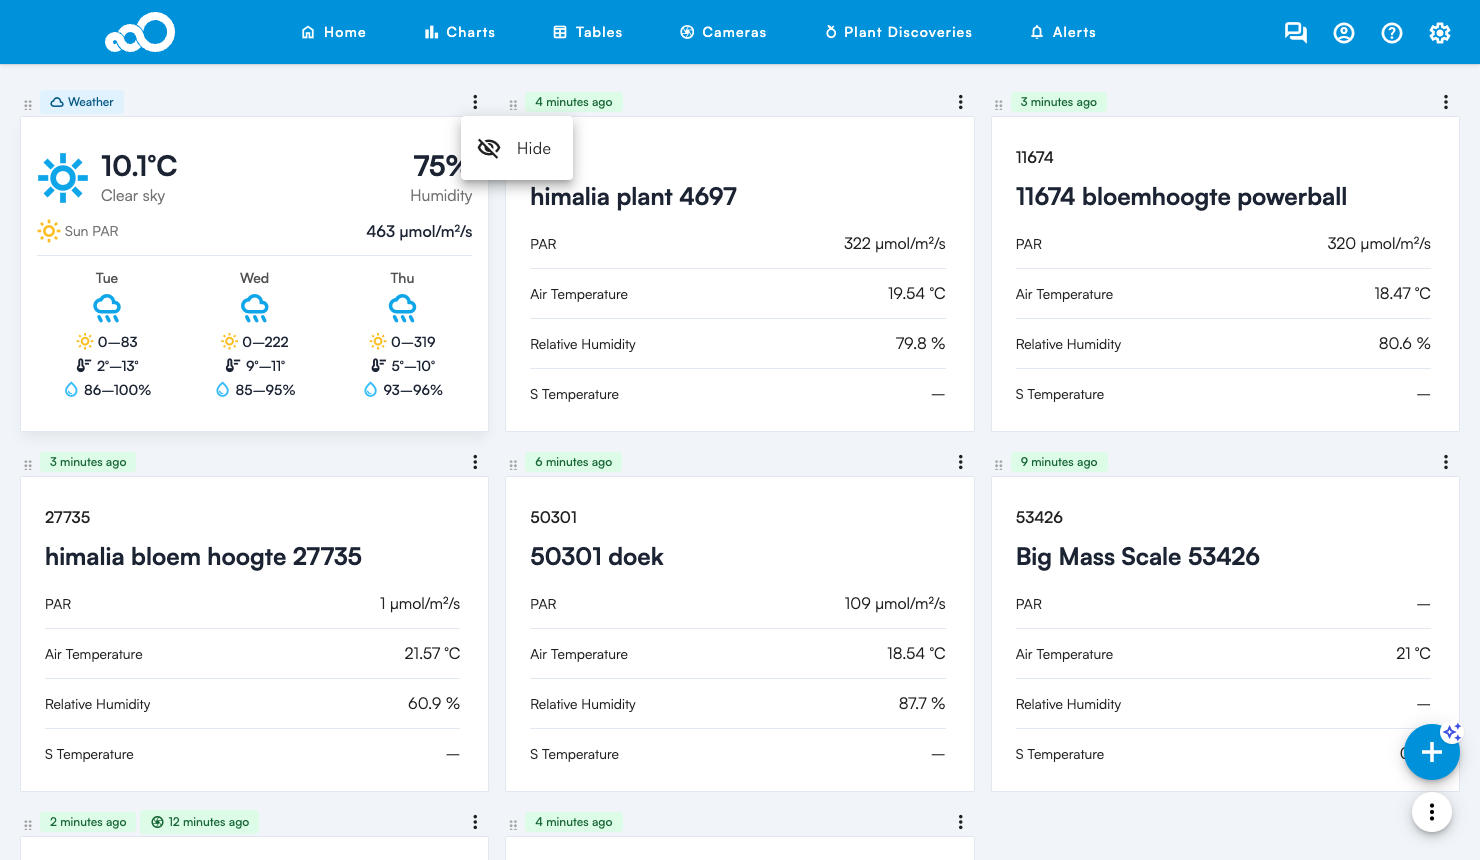
- Update - Hide the weather card
The weather card on the Home page has a ⋮ menu with Hide. A hidden weather card is listed in the bar at the bottom of the page: click it and choose Show to bring it back.

This is remembered in the browser, so you will have to adjust this per device.
- Update - Find a location by its ID
The location search now also finds a location by its ID, also after the location was renamed.
- Update - Drain Sense weights renamed
The Drain Sense weights "w1" to "w2" are now called "Weight 1" to "Weight 2".
- Update - Visual Map: choose the variables again
On the Visual Map the variable list is back, so you can choose which variables the devices show. The variables now have readable names, in your language.
Bug Fixes
- Fix - Home page - the size and order of your cards and widgets are now kept after a refresh or after leaving the page.
- Fix - Widgets - line charts now always show the time of your location. Before, they were shifted by a few hours when your computer was in a different time zone than the location.
- Fix - Widgets - an average over several devices no longer shows spikes that are not in the data.
- Fix - Widgets - fixed the line colours of widgets with limits.
- Fix - Widgets - the colours on hover now match the legend.
- Fix - Widgets - a new user of a location with widgets no longer sees "No API key" on them.
- Fix - Charts page - clicking on the chart no longer makes the values under your mouse disappear.
- Fix - Charts page - cameras that only recognise leaves no longer show empty flower lines.
- Fix - Variable "humid_deficit" is shown as "Humidity Deficit" again.